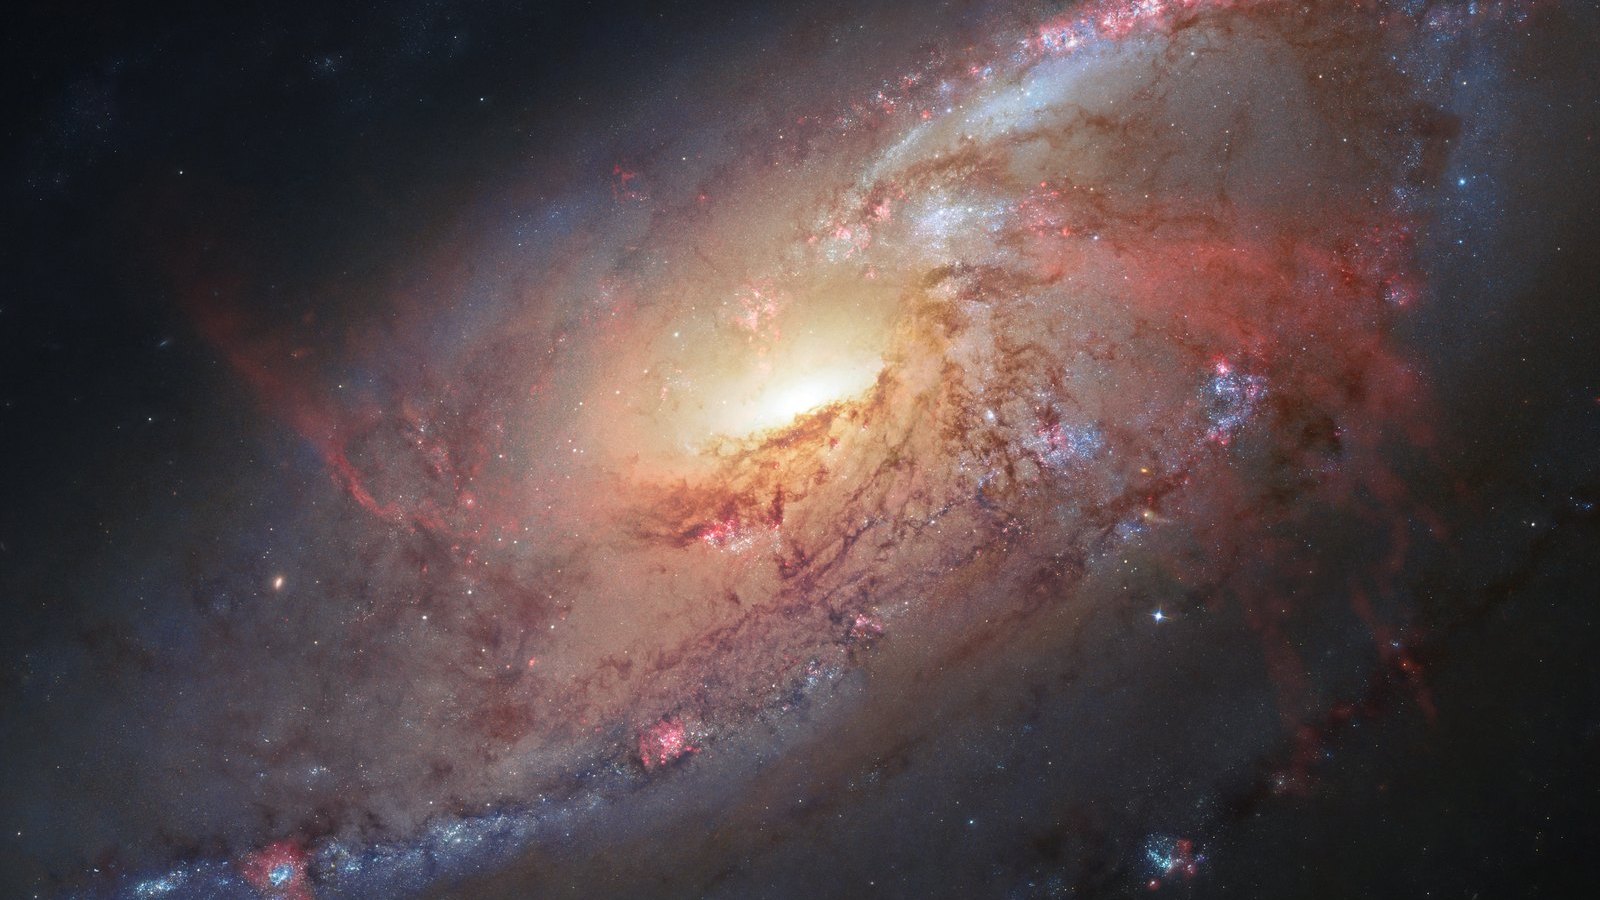
 Image: NASA, ESA, the Hubble Heritage Team (STScI/AURA), and R. Gendler (for the Hubble Heritage Team). Acknowledgment: J. GaBany
The Hubble tension explained for students
The universe is expanding at 73 km/s per megaparsec if you measure the expansion directly with nearby galaxies, and at 67 if you predict it from the afterglow of the Big Bang. Each number carries an uncertainty of about 1 percent, and they differ by 9 percent. This disagreement is called the Hubble tension. After more than ten years of checking, it has not gone away, and in 2026 it is one of the main open problems in cosmology.
What the Hubble constant is
Galaxies move away from us at speeds proportional to their distances: \(v = H_0 d\). The factor \(H_0\) is the Hubble constant, the expansion rate of the universe today. With \(H_0 = 70\) km/s per megaparsec, a galaxy 100 megaparsecs away (326 million light years) recedes at 7,000 km/s.
The inverse of \(H_0\) is a time, and for a value of 70 it comes to 14.0 billion years. That is close to the age of the universe, which is no accident: a faster expansion means the universe needed less time to reach its present size. Georges Lemaître derived the relation in 1927 and Edwin Hubble established it with more data in 1929. Hubble's value was near 500, far too high because his distances were too short. By 2001 the Hubble Space Telescope had brought the number to 72 ± 8, and everyone expected the error bar to shrink around one value.
The local route with a distance ladder
To measure \(H_0\) directly you need the speeds and the distances of galaxies. Speeds come easily from the redshift of spectral lines. Distances are the hard part, and they are built up in steps: parallax for nearby stars, pulsating Cepheid stars for nearby galaxies, and Type Ia supernovae for distant ones. The steps are described in how astronomers measure the distance to the stars.
The galaxy in the picture above, Messier 106, is one of the anchors of this ladder. Clouds of water vapor orbit its central black hole and emit sharp radio lines, and their orbits give a distance of 7.58 megaparsecs from geometry alone. Cepheids in the same galaxy then fix the Cepheid brightness scale.
The SH0ES team led by Adam Riess obtained 73.04 ± 1.04 this way in 2022. In 2026 a collaboration of more than a hundred researchers, the H0 Distance Network, published a combined analysis of Cepheids, red giant stars, supernovae and several other indicators with their shared errors taken into account. Its result is 73.50 ± 0.81.
The early route with the microwave background
The second method never looks at a galaxy. Before the universe was 380,000 years old it was filled with hot plasma, and sound waves ran through it. When the plasma turned into transparent gas the waves stopped, and the distance they had covered by then, about 147 megaparsecs when scaled to the present size of the universe, was frozen into the pattern of hot and cold spots of the cosmic microwave background.
Physics gives the true size of that pattern and the observations give its angular size on the sky, a little over half a degree. The ratio depends on how the universe has expanded in the 13.8 billion years since. If you assume the standard model of cosmology, with ordinary matter, cold dark matter and a cosmological constant, the data fix its parameters, and the present expansion rate follows. The Planck satellite gave 67.4 ± 0.5 in 2018. In 2025 the South Pole Telescope combined its new maps with Planck and the Atacama Cosmology Telescope and found 67.2 ± 0.4.
Keep in mind what kind of number each one is. The ladder gives a measurement, and its weak point is calibration. The microwave value is a prediction, only as good as the model used to extrapolate from the first 380,000 years to today.
The numbers side by side
| Method | \(H_0\) (km/s per Mpc) | Year |
|---|---|---|
| Planck microwave background | 67.4 ± 0.5 | 2018 |
| South Pole Telescope, ACT and Planck combined | 67.2 ± 0.4 | 2025 |
| Red giant stars and supernovae (Chicago-Carnegie) | 70.4 ± 1.9 | 2025 |
| Time delays of gravitationally lensed quasars | 72.1 (+4.0, -3.7) | 2025 |
| Cepheids and supernovae (SH0ES) | 73.0 ± 1.0 | 2022 |
| H0 Distance Network, combined local value | 73.5 ± 0.8 | 2026 |
The gap between the last row and the second is 6.3 km/s per megaparsec. The combined uncertainty is 0.9, so the two differ by 7 standard deviations. A fluctuation of that size does not happen by chance.
Could it be a measurement error?
For years the favorite suspect was the Cepheids. In distant galaxies they sit in crowded star fields, and light from neighbors could make them look too bright. The James Webb Space Telescope sees nearly three times sharper than Hubble at the same infrared wavelength. In 2024 it re-observed more than a thousand of the same Cepheids and confirmed Hubble's photometry, which closed that exit.
Not everyone is convinced the ladder is settled. Wendy Freedman's group in Chicago uses red giant stars in place of Cepheids and finds 70.4 with a total uncertainty near 1.9, a value that sits between the camps and lies within two standard deviations of both. The Distance Network reports that leaving out either Cepheids or red giants changes its answer very little. On the other side, three microwave experiments with different instruments and different patches of sky agree with each other.
A method that uses neither ladder nor microwaves would help. Quasars whose light is bent into several images by a foreground galaxy provide one, and their current value of 72 has an error bar too wide to decide the matter. Merging neutron stars observed in gravitational waves provide another, but so far only one event, in 2017, has had a securely identified host galaxy.
Or is the model incomplete?
If both numbers are right, the standard model that connects them is missing something. The most studied idea is early dark energy: an extra ingredient that made up around 10 percent of the cosmic energy shortly before the plasma cleared and then faded away. It would have sped up the early expansion and shortened the distance the sound waves traveled. A shorter ruler raises the predicted \(H_0\). The idea fits the microwave data only with some strain, and it worsens a smaller disagreement about how strongly matter clumps.
A separate crack appeared in 2025. The DESI survey mapped more than 14 million galaxies and quasars and found that its data, combined with supernovae and the microwave background, prefer a dark energy that changes with time over a constant one, at 2.8 to 4.2 sigma depending on the supernova sample. The finding leaves the two values of \(H_0\) as far apart as before, and it adds a second hint that the standard model is incomplete.
New data are close. The fourth Gaia release on 2 December 2026 will improve the parallaxes at the base of the ladder, and Webb continues to observe Cepheids and red giants in supernova host galaxies.
The A&A Masterclass comes to this problem in three steps. Unit 13 derives the expansion equations and shows how the Hubble constant is measured with the distance ladder, Unit 14 explains the sound waves in the microwave background, and Unit 15 discusses the tension together with dark energy and the DESI results. The curriculum has the full outline.