 Image: braincontour / Pexels
The cosmic microwave background in plain words
The cosmic microwave background, usually shortened to CMB, is faint microwave light coming to us from every direction in space. It is one of the strongest pieces of evidence that the universe was once much hotter and denser than it is now. If you could tune a radio receiver to the right frequency and remove almost every other source of noise, a tiny signal would still remain. That signal is the CMB.
In simple terms, it is the oldest light we can observe with telescopes. We do not see it with our eyes because it is microwave radiation, far longer in wavelength than visible light. We detect it with carefully built instruments in space, on balloons, and from high, dry ground. Its average temperature today is about 2.725 kelvin, which is just above absolute zero.
What the cosmic microwave background is
About 380,000 years after the Big Bang, the universe had cooled enough for electrons and protons to combine into neutral hydrogen atoms. Before that time, the universe was a hot fog of charged particles. Light could not travel freely because it kept scattering off electrons. Once neutral atoms formed, light could move through space much more easily. That released light is what we now detect as the CMB.
At the time it was emitted, that radiation was not microwave radiation. It was much hotter and its peak wavelength was in the visible and infrared range. As the universe expanded, the wavelengths of that light stretched. Stretching a wave lowers its energy and shifts it toward longer wavelengths. After about 13.8 billion years of expansion, that ancient light now reaches us as microwaves.
The idea fits the basic expansion of the universe very well. If space expands by a factor of about 1100 since that era, then the temperature of the radiation drops by the same factor. A radiation field that was roughly 3000 kelvin then would cool to about 2.7 kelvin now. That is close to what we measure.
How it was found in 1965
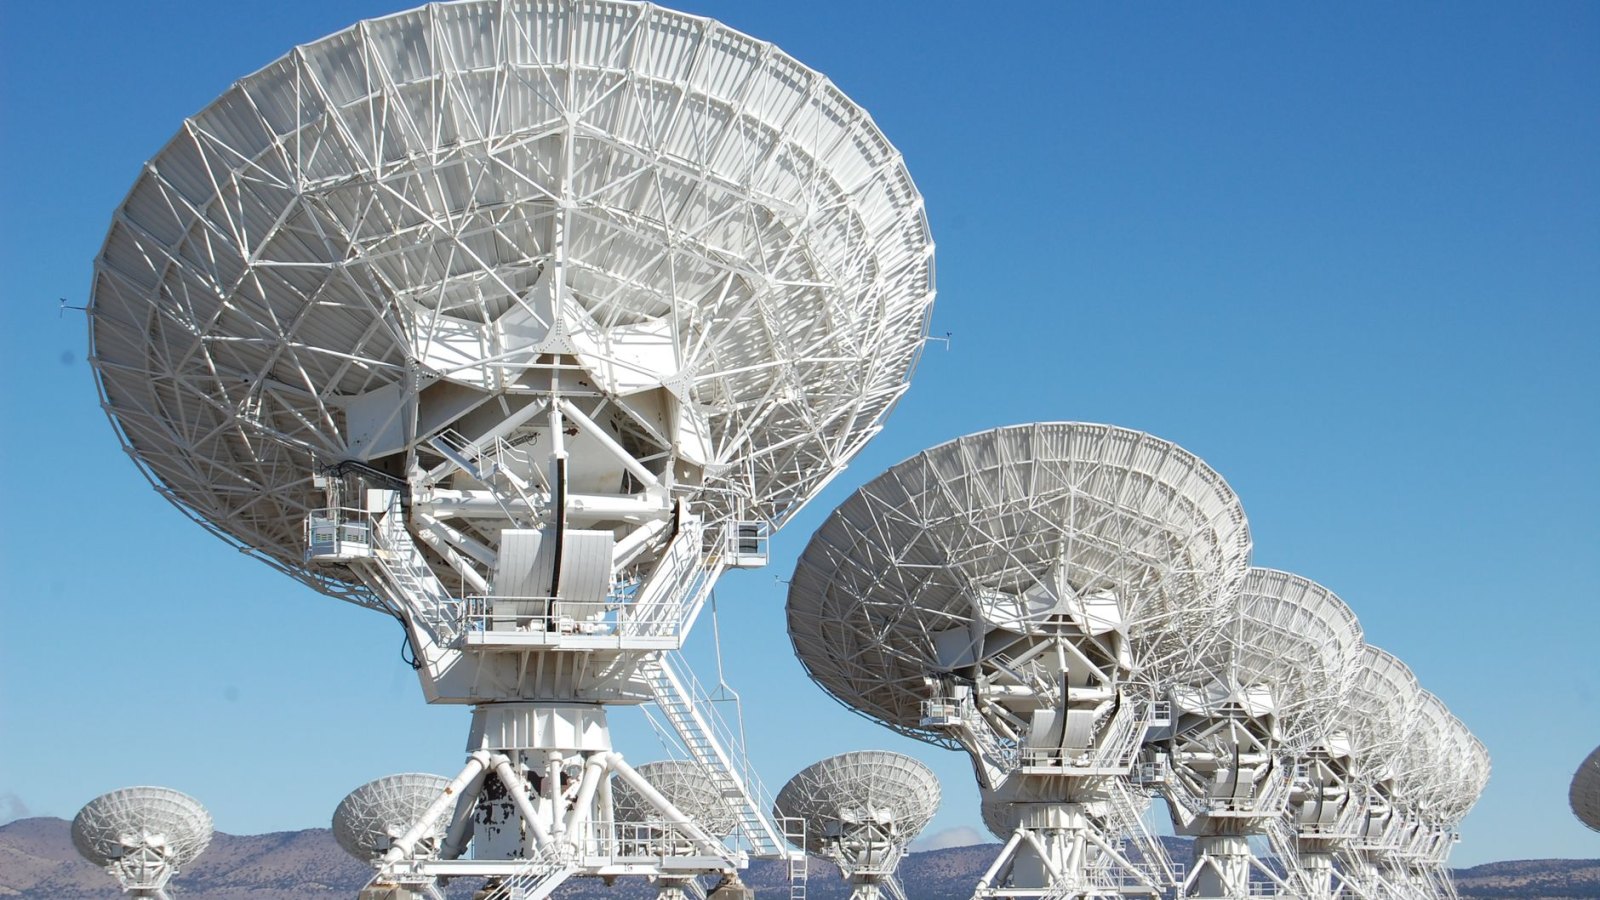
The CMB was detected by accident in 1965 by Arno Penzias and Robert Wilson at Bell Labs in New Jersey. They were using a large horn antenna for radio astronomy and satellite work. Their receiver kept picking up a faint background noise that they could not remove. The signal seemed to come from every direction in the sky.
They checked many possible causes. They examined the equipment, the electronics, and the antenna itself. They even removed pigeon droppings from the antenna, since they thought the birds might be part of the problem. The noise remained. At the same time, a group at Princeton University, led by Robert Dicke, was working on the prediction that relic radiation from the early universe should still exist. When the two groups spoke, the meaning of the signal became clear.
Penzias and Wilson published their measurement in 1965 in Astrophysical Journal Letters. Their paper reported an excess antenna temperature of about 3.5 kelvin. The discovery earned them the 1978 Nobel Prize in Physics. The important point is that the signal was not a local problem in the instrument. It was a sky-wide background, exactly the kind of relic radiation cosmologists had expected.
Why the temperature map matters
The CMB is almost uniform, but it is not perfectly smooth. If you make a temperature map of the whole sky, you see tiny differences from place to place. These differences are extremely small, usually around one part in 100,000. That means the average temperature is about 2.725 kelvin, while the variations are only tens or hundreds of microkelvin.
These tiny hot and cold spots are very useful. They show where the early universe had slightly more matter or slightly less matter than average. Gravity then had more material to work with in the denser regions. Over long times, those slight differences grew into the cosmic web of galaxies and clusters we see today.
The first full-sky maps came from the COBE satellite in the early 1990s. COBE showed the CMB was nearly a perfect blackbody spectrum, which is what physicists expected from a hot, dense early universe. It also found the first tiny temperature variations. Later missions, especially WMAP and Planck, mapped those variations with far better detail.
Those patterns are more than a pretty picture. They let scientists measure the age, geometry, and contents of the universe. The pattern of spots depends on the amounts of ordinary matter, dark matter, and dark energy, as well as the rate of expansion. The map also shows the scale of sound waves that moved through the hot plasma before atoms formed. Those early sound waves left a preferred angular size in the pattern on the sky.
What the pattern tells us about the early universe
The temperature map contains a great deal of information. One of the clearest lessons is that the early universe was very smooth. If it had been much lumpier, the sky pattern would look very different from what we see. The observed small variations match the idea that tiny quantum fluctuations were stretched to cosmic size during the very early universe, long before the CMB was released.
The map also helps measure the universe’s age. When combined with other observations, the CMB data point to an age of about 13.8 billion years. It gives a value for the geometry of space that is very close to flat on large scales. It also shows that ordinary matter makes up only a small part of the cosmic energy budget, with dark matter and dark energy making up most of it.
Here is one simple way to think about the CMB map. Imagine the early universe as a nearly smooth soup. Some places were a little denser than others. When light was finally able to travel freely, it carried a record of those small density differences. The map is that record. We are reading a snapshot taken when the universe was only a few hundred thousand years old.
| Feature | What it means |
|---|---|
| Average temperature | About 2.725 kelvin today |
| Tiny hot and cold spots | Early density differences in the universe |
| Overall smoothness | The early universe was very uniform |
| Spot pattern on the sky | Evidence for sound waves in the early plasma |
Why it still matters now
The CMB is one of the best ways to test ideas about cosmology. Any theory about the early universe has to fit what the CMB shows. That includes the average temperature, the tiny anisotropies, and the way those anisotropies vary with angular scale. Because the measurement is so precise, it has become a standard reference point for the whole field.
It also gives a rare direct link between the present sky and the early universe. We cannot travel back to that time, but the CMB lets us observe a remnant from it. In that sense, it is a natural archive of cosmic history.
For students beginning astrophysics, the CMB is a good example of how a weak signal can reshape a field. A faint background hiss became evidence for the hot Big Bang, then a tool for measuring the universe itself. That kind of inference is central to astronomy.
In the curriculum of the Astronomy & Astrophysics Masterclass, the CMB connects ideas about radiation, expansion, and the early universe in one topic.