 Image: Design Bits / Pexels
How we know what stars are made of
Stars are too far away to sample directly. We cannot scoop up a bit of the Sun or reach into a red giant with a probe. Yet astronomers can still tell what stars are made of by studying the light they send us. The key tool is spectroscopy, the study of light split into its component wavelengths. When that light is spread out, it reveals dark and bright lines that act like a chemical fingerprint.
This method changed astronomy in the 1800s and transformed it again in the 1920s, when Cecilia Payne showed that stars are mostly hydrogen and helium. That result seems obvious now, but it was far from obvious then. It took careful physics, a new way to read spectra, and a willingness to trust the evidence even when it went against common ideas.
From white light to a spectrum
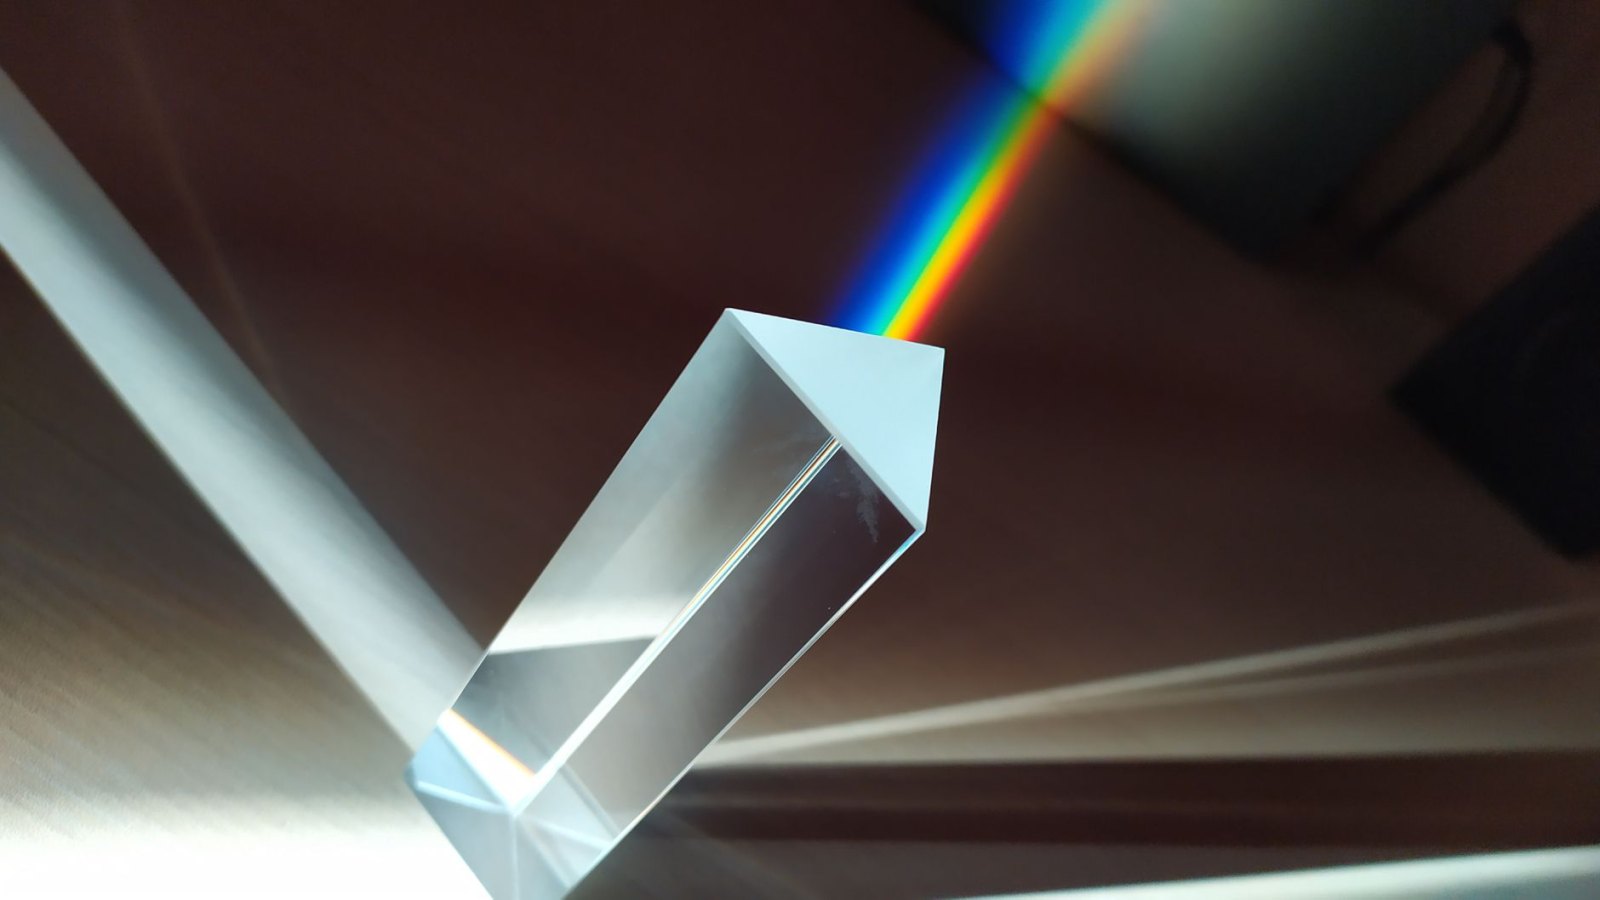
Sunlight looks white to our eyes, but a prism or a diffraction grating can spread it into a band of colors from red to violet. That band is a spectrum. Different wavelengths in the spectrum carry different amounts of energy, so a spectrum gives more information than a plain point of light.
In the early 1800s, William Hyde Wollaston noticed a few dark gaps in the Sun’s spectrum. Soon after, Joseph von Fraunhofer studied those gaps in detail. He measured many of them and mapped their positions with great care. Today we call them Fraunhofer lines. They are dark absorption lines that appear when cooler gas lies in front of a hotter light source.
The basic reason is simple. Atoms and ions absorb light at very specific wavelengths. If a beam of continuous light passes through gas, the gas removes some wavelengths and leaves dark lines in the spectrum. Each chemical element has its own pattern of lines. Hydrogen, sodium, calcium, iron, and other elements each absorb different wavelengths. That gives astronomers a way to identify the material between us and the light source.
Why lines appear in stellar spectra
A star is not a solid ball with a surface like a rock. Most of what we see is a hot, dense layer called the photosphere. It produces a near continuous spectrum, a broad spread of light across many wavelengths. Above that layer is thinner gas. As light from the photosphere passes through the gas, some wavelengths are absorbed. The result is a continuous spectrum with dark absorption lines on top.
The exact pattern of those lines depends on temperature, density, and chemical composition. Temperature matters because atoms in hotter gas are more likely to be ionized or excited, which changes the lines they produce. Pressure matters because collisions can broaden the lines. Composition matters because each element adds its own set of fingerprints.
Some stars also show emission lines. In that case, hot thin gas emits light at specific wavelengths, so the lines appear bright against a darker background. Astronomers use both absorption and emission lines, but for ordinary stars the absorption spectrum is the main source of information about chemical makeup.
The same physics works for the Sun. Fraunhofer lines in sunlight tell us which atoms absorb light in the solar atmosphere. By comparing the solar spectrum with laboratory spectra measured on Earth, astronomers can match line patterns and identify elements. That comparison is one of the strongest examples of how physics connects the laboratory to the sky.
How astronomers read a stellar fingerprint
Modern spectrographs record a star’s spectrum on a detector, often a digital sensor. The instrument spreads the light into many tiny wavelength bins, and software turns the result into a graph of intensity versus wavelength. In that graph, dark dips mark absorption lines. The depth, width, and shape of the lines all carry information.
To identify an element, astronomers compare the observed lines with known wavelengths measured in the lab. For example, the hydrogen Balmer lines in the visible range include H-alpha at 656.3 nanometers and H-beta at 486.1 nanometers. Sodium produces the famous yellow doublet near 589.0 and 589.6 nanometers. Calcium, iron, magnesium, and many other elements produce lines across the spectrum.
Line strength does not depend only on how much of an element is present. A weak line can come from a rare element, but it can also come from a common element in the wrong temperature range. Astronomers therefore use models of stellar atmospheres to infer abundances. Those models take into account ionization, temperature, density, and how strongly each transition absorbs light.
For bright nearby stars, this method can measure the abundance of many elements to good precision. It also works for distant galaxies, where the same physics lets astronomers study the gas between stars and in the early universe. The principle stays the same. Light carries the information.
Cecilia Payne and the real abundance of the stars
In 1925, Cecilia Payne completed her doctoral dissertation at Harvard. She used spectroscopy and the new ideas of atomic physics to study stellar spectra in detail. Her conclusion was bold: the stars are made mostly of hydrogen, with helium next, while heavier elements make up only a small fraction by mass.
That result ran against the common view of the time. Many astronomers assumed that stars had roughly the same composition as Earth’s crust, because the strongest spectral lines often came from heavier elements such as iron, calcium, and sodium. Payne showed that strong lines do not automatically mean high abundance. A line can be strong because the atom absorbs well at a certain temperature, not because it is common.
Her work relied on the Saha ionization equation, which links temperature and ionization. That let her interpret why some lines appear strong in some stars and weak in others. She showed that the apparent richness of heavy elements in stellar spectra was misleading. Hydrogen is by far the most abundant element in stars, and helium is second.
A few years later, Henry Norris Russell reached a similar conclusion and helped confirm it, but Payne’s dissertation was the first clear statement of the result. Today her work is seen as one of the major advances in astrophysics. It changed how astronomers think about stars, and it set the stage for our modern picture of cosmic chemistry.
What stellar spectra tell us today
Spectroscopy does more than say whether a star contains hydrogen or iron. It tells us about temperature, surface gravity, rotation, magnetic fields, and motion. If a star moves toward us, its lines shift to shorter wavelengths. If it moves away, they shift to longer wavelengths. This Doppler shift lets astronomers measure radial velocities.
Spectra also reveal unusual stars. Some have strong carbon lines. Some show signs of heavy elements formed by neutron capture. Some have atmospheres polluted by material from planets or companion stars. Others, such as very hot O-type stars, have ionized helium lines that only appear at extreme temperatures.
Every one of these results depends on the same core idea: atoms and ions absorb and emit light at specific wavelengths. Fraunhofer lines in the Sun were an early clue. Stellar spectroscopy turned that clue into a full method. Cecilia Payne then used that method to show that the universe’s most common stellar ingredients are hydrogen and helium, the lightest elements in the periodic table.
| Feature | What it means | What it tells astronomers |
|---|---|---|
| Continuous spectrum | A smooth spread of colors | Overall temperature and energy output |
| Absorption lines | Dark missing wavelengths | Which elements are in the star’s atmosphere |
| Line shift | Wavelength change from motion | Radial velocity |
| Line width and shape | How broad the lines are | Rotation, pressure, magnetic effects |
What makes this story special is that it joins laboratory physics with astronomy. A pattern measured on Earth can explain the light of a star 100 light-years away, or 10,000 light-years away. The same atoms behave the same way in both places, and that is what makes stellar spectroscopy so powerful.
If you want to see how this fits into the wider study of stars and light, the curriculum of the Astronomy & Astrophysics Masterclass is a useful place to start.